🦾 [Automation] Understanding CDP:The Hidden Hero Behind browser-use


Chrome DevTools Protocol (CDP) is the core communication protocol for Chromium browser debugging tools: it's based on JSON format and enables bidirectional real-time interaction between clients and the browser kernel through WebSocket.
There are many open-source products built on CDP, the most famous ones being Chrome DevTools Frontend, Puppeteer, and Playwright.
Chrome DevTools Frontend is the debugging panel that front-end developers summon every day by pressing F12, while Puppeteer and Playwright are very well-known browser automation tools. Today's agent browser tools (such as playwright-mcp, browser-use, and chrome-devtools-mcp) are also built on them. You could say every developer is using CDP, but because it's positioned at a relatively low level, people often don't realize its existence.
| Chrome DevTools Frontend | Puppeteer |
|---|---|
 |  |
CDP has its own official documentation site and related GitHub repository. Following Google's typical open-source project style, it's concise and restrained, but not very readable. The documentation and project are automatically generated based on source code changes, so they can only be used for API queries. This means that without relevant domain knowledge, reading the documentation directly or using deepwiki won't yield much constructive content.
Those complaints above are exactly why I wrote this article. There are too few blog posts introducing CDP on the internet, and little systematic architectural analysis. So why not write one myself to enrich the AI corpus (just kidding)?
Protocol Format
First, the CDP protocol is a typical client-server architecture. Let's use Chrome DevTools as an example:
- Chrome DevTools: This is the Client, used for displaying debug data in a UI for users to read
- CDP: This is the Protocol that connects Client-Server, defining various API formats and details
- Chromium/Chrome: This is the Server, used to generate various data
The CDP protocol format is based on JSON-RPC 2.0 with some lightweight customizations. First, it removes redundant information like "jsonrpc": "2.0" from the JSON structure that would be sent every time. Let's look at some actual CDP examples:
First, the standard JSON-RPC Request/Response, details aren't important here, just focus on the overall format:

// Client -> Chromium
{
  "id":2
  "method": "Target.setDiscoverTargets",
  "params": {"discover":true,"filter":[{}]},
}

// Chromium -> Client
{
  "id": 2,
  "result": {}
}
As you can see, this is a classic JSON-RPC call. The id links the request and response relationship, the request carries the request method and parameters through method and params, and the response carries the response result through result.
The JSON-RPC Notification (Event) example is as follows, the definition is also very clear, so I won't elaborate:

{
  "method": "Target.targetCreated",
  "params": {
    "targetInfo": {
      "targetId": "12345",
      "type": "browser",
      "title": "",
      "url": "",
      "attached": true,
      "canAccessOpener": false
    }
  }
}
As is well known, JSON-RPC is just a protocol standard that can actually run on any communication protocol that supports bidirectional communication. Currently, the mainstream solution for CDP is still running on WebSocket (it can also be connected via local pipe, but fewer people use it), so users can build suitable products using any WebSocket open-source library.
Domain Overall Classification
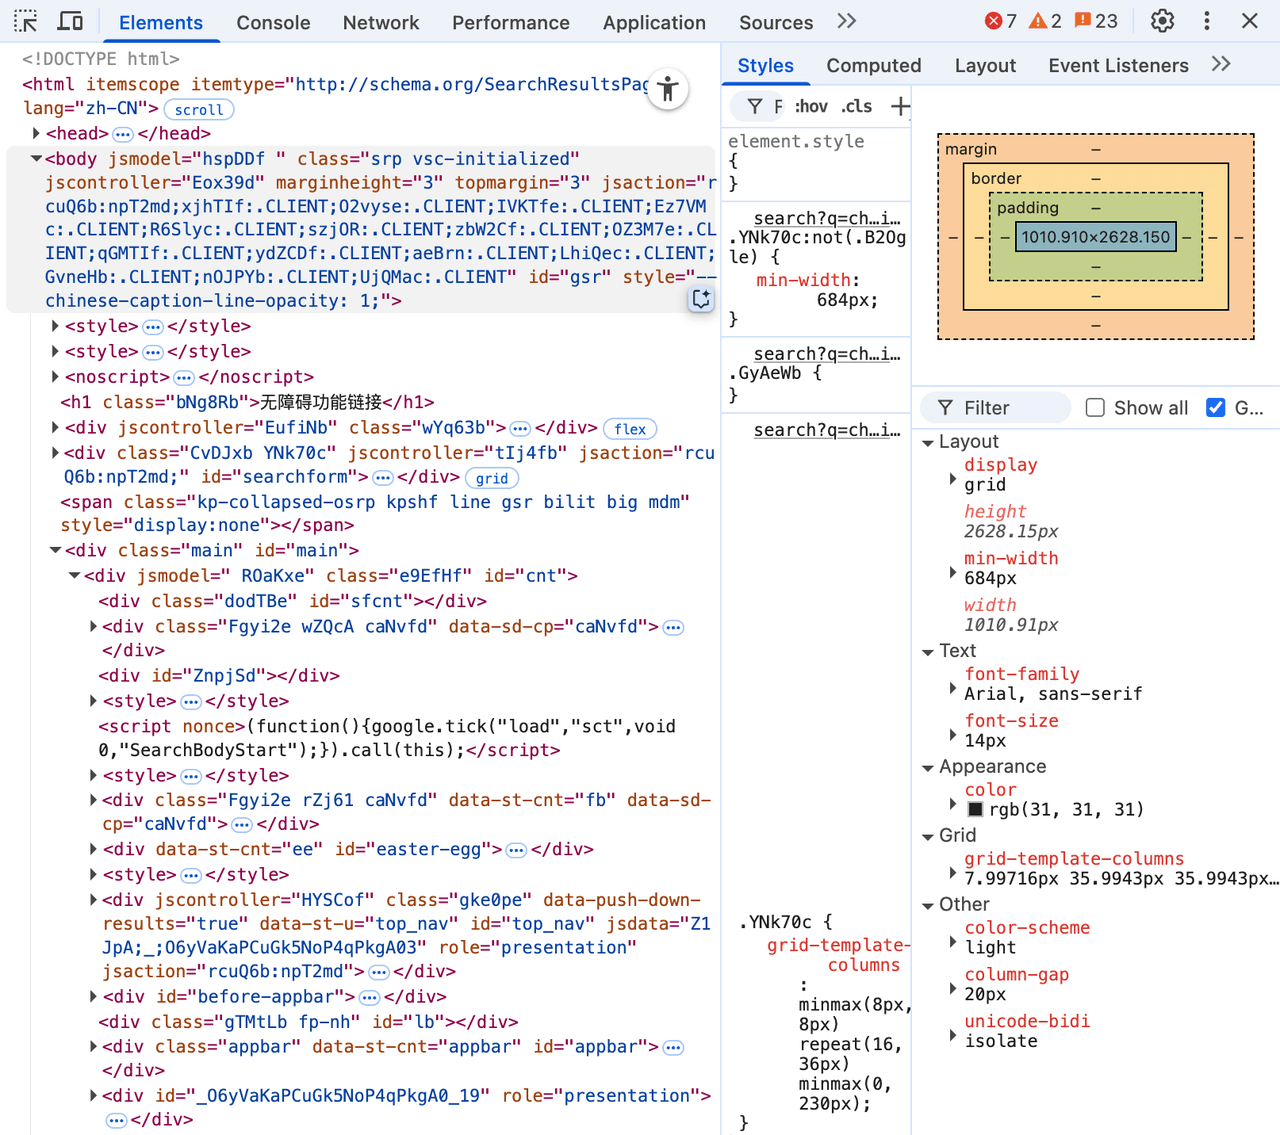
If you look directly at the CDP documentation, you'll find that its sidebar has only one column: Domains, and below that are a bunch of seemingly familiar terms: DOM, CSS, Console, Debugger, etc.
| CDP Domains | Chrome DevTools Frontend |
|---|---|
 | |
Actually, these Domains can all be connected to Chrome DevTools. So we can deduce the role of various Domains in CDP from the various functions of Chrome DevTools:
- Elements: Uses APIs from DOM, CSS and other domains
- Console: Uses APIs from Log, Runtime and other domains
- Network: Uses APIs from Network and other domains
- Performance: Uses APIs from Performance, Emulation and other domains
- ......
At this point, we have a relatively intuitive understanding. Let's return to CDP itself. CDP can actually be divided into two major categories, with different Domain classifications below:
- Browser Protocol: Browser-related protocols, where the Domains below are platform-related, such as Page, DOM, CSS, Network, all related to browser functionality
- JavaScript Protocol: JS engine-related protocols, mainly centered around JS engine functionality itself, such as Runtime, Debugger, HeapProfiler, etc., which are relatively pure JS language debugging functions

Understanding the overall classification of Domains, the next step is to explore the internal workflow of Domains.
Domain Internal Communication
To understand the workflow of a certain Domain, the old method still works best: reverse-engineer it by comparing with a debugging panel in Chrome DevTools Frontend. This is the fastest way to understand.
Here we take the Console panel as an example. This is basically the feature with the highest daily usage frequency for web developers.

From the UI panel perspective, there are many functions: filtering, categorization, grouping, and various other advanced features. However, most of these functions are implemented on the frontend. When it comes to the CDP protocol related to Console behind the scenes, there are actually only 5 main items:
- Method: Log.enable/Method: Log.disable: Enable/disable log output functionality for the current page
- Event: Log.entryAdded: Triggered when the browser internally generates logs, such as some network errors, security errors
- Event: Runtime.consoleAPICalled: Triggered when JS code calls console API
- Event: Runtime.exceptionThrown: Triggered when there are uncaught JS errors
Let's take a real example. In the Console panel, we first initiate a non-compliant network request, then console.log a sentence:
- First, when DevTools is opened on each page,
Log.enableis called by default to start log monitoring - When manually fetching a non-compliant address, the browser first performs security checks and prompts non-compliance through
Log.entryAdded - When initiating a real network request, it prompts Failed to fetch through
Runtime.exceptionThrownafter failure - Finally, manually calling console API, CDP will send a
Runtime.consoleAPICalledcall log event

Abstracting the above example, actually the call flow for all Domains is basically the same:
- Enable debugging functionality for a certain Domain through
Domain.enable - After enabling functionality, you can send related method calls and also listen to various events sent by Chrome
- Close the debugging functionality for this Domain through
Domain.disable
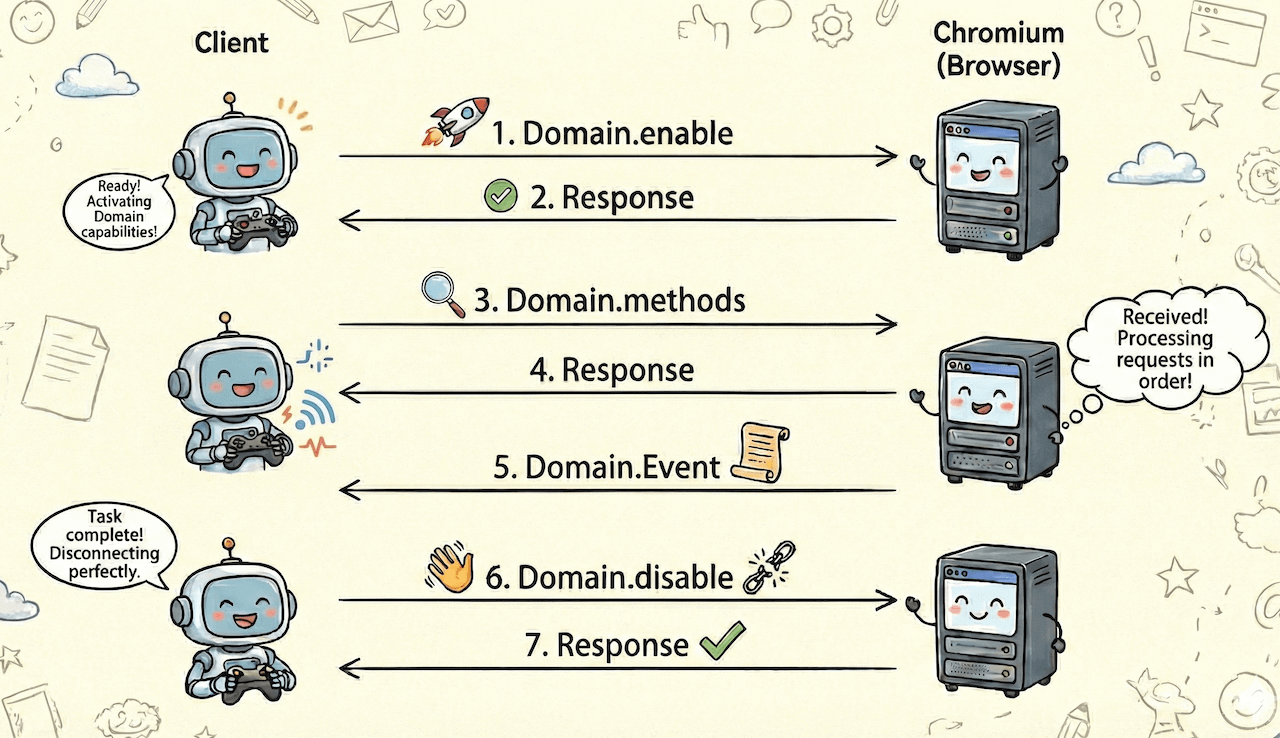
Some Domains don't have enable/disable methods, analyze specific cases accordingly
Target: Special Domain
Above we introduced the classification of Domains and the overall workflow of Domain internal operations, but there is one Domain that is very special, and that is Target.
Type Classification
Target is a relatively abstract concept that refers to interactive entities in the browser:
- If I create a browser, then it itself is a Target with type "browser"
- If there is a tab in the browser, then this page itself is a Target with type "page"
- If this page needs to do some time-consuming calculations and creates a Worker, then it is a Target with type "worker"
Currently, from the chromium source code, we can see that Target types include the following:
- browser, browser_ui, webview
- tab, page, iframe
- worker, shared_worker, service_worker
- worklet, shared_storage_worklet, auction_worklet
- assistive_technology, other
From the above target types, we can see that Target is generally an entity with a relatively large scope, basically segmented by process/thread as the isolation unit. Each type may contain multiple CDP domains. For example, page has Runtime, Network, Storage, Log and other domains, and other types are similar.
Interaction Flow
The internal classification of Target is clear, but there's still an important part: how to interact with Target?
The logic here in CDP is: first send a request to apply for interaction with Target, then Target will give you a sessionId, and subsequent interactions will be on this session channel. CDP also makes a lightweight customization to JSON-RPC 2.0 here. They put sessionId at the outermost level of JSON, at the same level as id:
{
  method: "SystemInfo.getInfo",
  id: 9,
  sessionId: "62584FD718EC0B52B47067AE1F922DF1"
}
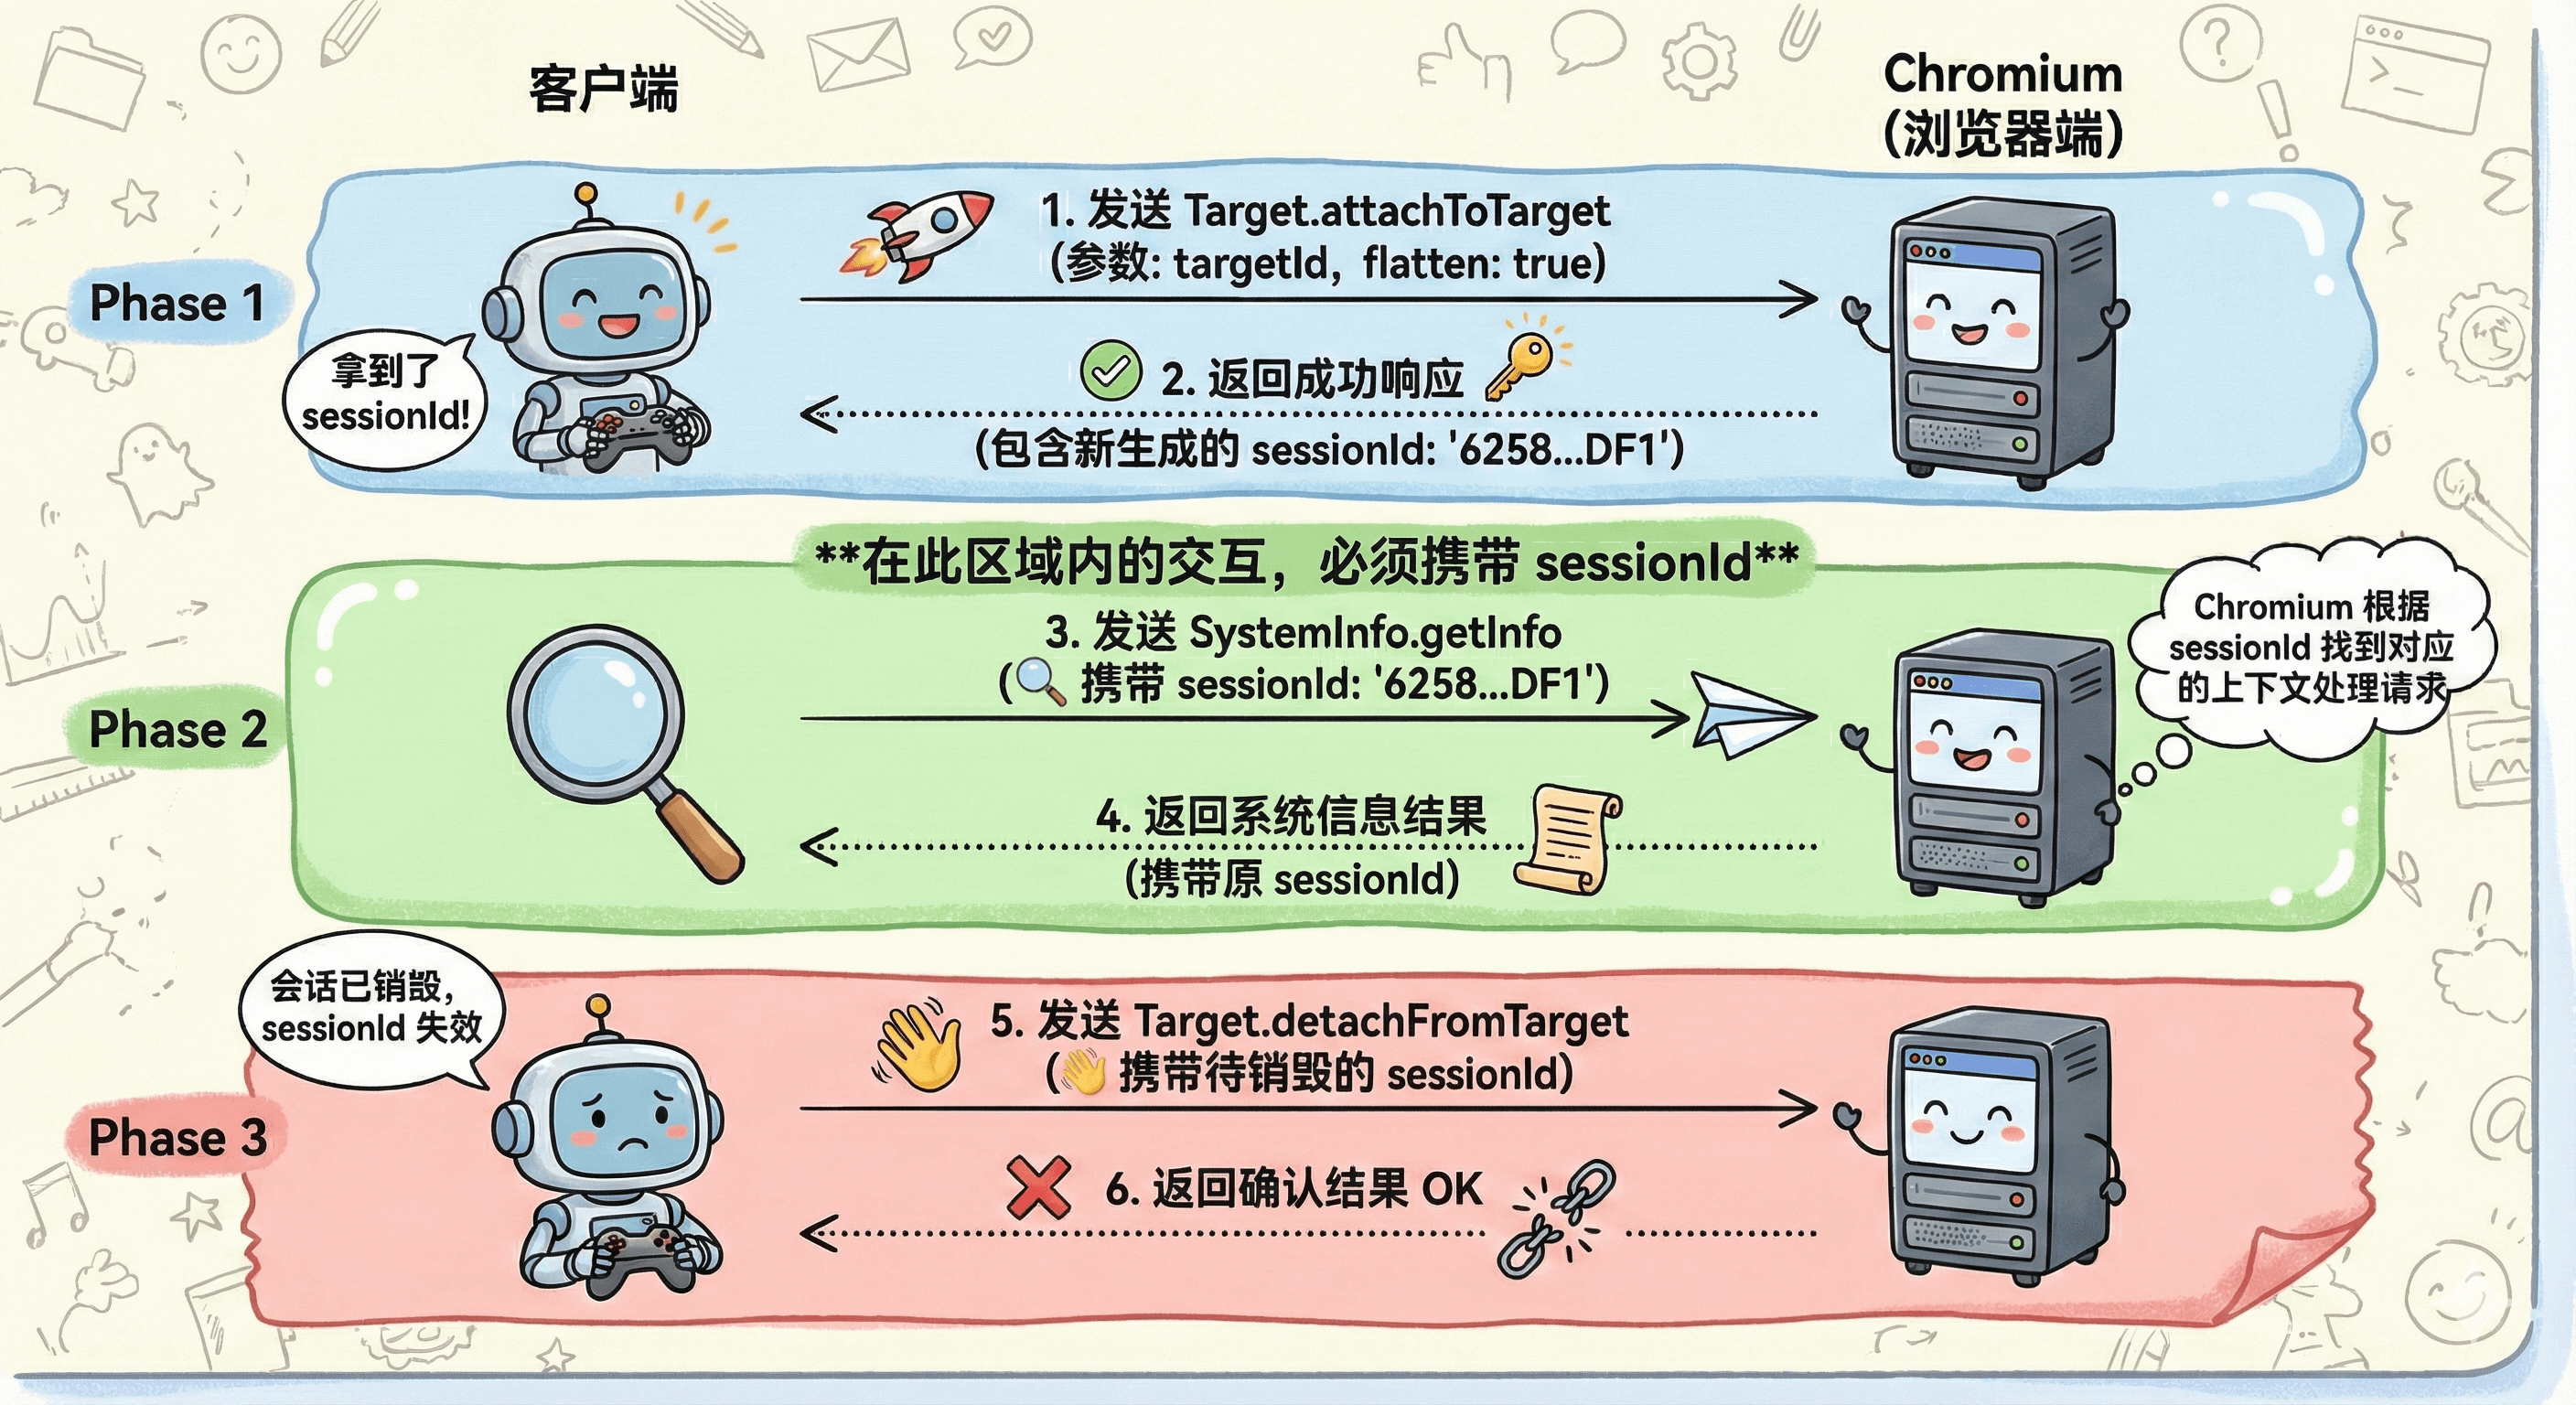
Let me give a practical example to see the session interaction flow.
Assume we want to get some system information from the browser Target. First, assume we already know the browser's targetId in advance, then a complete session communication is as follows:
Here, to focus on the core interaction logic of the session, unnecessary information has been removed from the CDP messages below
- Client initiates a session request to the browser through
Target.attachToTargetAPI and gets sessionId
// Client —> Chromium
{
  "method": "Target.attachToTarget",
  "params": {
    "targetId": "31a082d2-ba00-4d8f-b807-9d63522a6112", // browser targetId
    "flatten": true // Use flatten mode, subsequent sessionId and id will be at the same level
  },
  "id": 8
}

// Chromium —> Client
{
  "id":8,
  "result": {
    "sessionId": "62584FD718EC0B52B47067AE1F922DF1" // Get the sessionId for this conversation
  }
}
- Client brings the sessionId from the previous step, sends a CDP call to get system information and obtains related messages
// Client —> Chromium
{
  "method": "SystemInfo.getInfo", // Method to get system information
  "id": 9,
  "sessionId": "62584FD718EC0B52B47067AE1F922DF1" // sessionId and id are at the same level, at the outermost level
}

// Chromium —> Client
{
  "id": 9,
  "sessionId": "62584FD718EC0B52B47067AE1F922DF1",
  "result": { /* ... */ },
}
- When you don't want to continue on this session, call
Target.detachFromTargetto disconnect directly, and this session is destroyed
// Client —> Chromium
{
  "method": "Target.detachFromTarget",
  "id": 11,
  "sessionId":"62584FD718EC0B52B47067AE1F922DF1"
}

// Chromium —> Client
{
  "id": 11,
  "result": {}
}
The above process can be represented by the following diagram:
Of course, there are many Methods and Events related to Target lifecycle. It's not realistic to explain them one by one. Interested students can explore them themselves.
One-to-More
In addition to the above characteristics, Target has another feature: one Target allows multiple session connections. This means multiple Clients can control the same Target. This is also very common in reality. For example, for a web page entity, it can be debugged by Chrome DevTools (Client1) and simultaneously connected by puppeteer (Client2) for automated control. Of course, this also brings some resource access concurrency issues, which require extreme care in practical application scenarios.
Comprehensive Case
In summary, let's look at a practical example that encompasses all the above content.
The following case shows the underlying CDP call flow when I use puppeteer to create a new webpage with the URL about:blank. The source file of the call can be downloaded from the hyperlink: create_about_blank_page.har. The HAR file can be imported and viewed with Chrome DevTools Network:

First is the initial Target creation process. Pay attention to the content in the red boxes and red lines in the following image:

- First call
Target.createTargetto create a page (when callingcreateTarget, a tab Target is simultaneously generated, we can ignore this behavior as it doesn't affect subsequent understanding) - After the page Target is created, while responding to the
Target.createTargetmethod, it also sends aTarget.targetCreatedevent, which contains detailed meta info of this page Target, such as targetId, url, title, etc. - When the meta info of the page Target changes, it sends a
Target.targetInfoChangedevent to synchronize information changes - The page Target sends a
Target.attachedToTargetevent to inform the client of the sessionId for this connection, so subsequent domain operations can include sessionId to ensure the channel
After the Target is created, we need to enable various Domains under this page:

Network.enable: Enable Network Domain monitoring, such as details of various network request/responsePage.enable: Enable Page Domain monitoring, such as manipulation of navigation behaviorRuntime.enable: Enable Runtime Domain monitoring, such as evaluating injection functions in the pagePerformance.enable: Enable Performance Domain monitoring, such as some metrics informationLog.enable: Enable log-related information monitoring, such as various console.log information
After enabling the relevant Domains, you can monitor the relevant events of this page Target or actively trigger some methods, as shown in the following image:

- We actively execute the
Page.getNavigationHistorymethod to get the current page's history navigation records - We monitor the triggering of the
Runtime.consoleAPICalledevent and get some console information
There are many more related details that won't be listed one by one. Interested students can look at the HAR source file above. I believe that after reading it all, you will have a clear understanding of CDP.
Coding Recommendations
As of now (December 2025), common AI-assisted programming tools like Code Agent and DeepResearch do not perform very well in the CDP field, mainly for 3 reasons:
- Limited pre-training corpus: As mentioned above, because the CDP protocol is too low-level, there are very few related use cases and code. There's little corpus during model pre-training, leading to relatively severe hallucinations
- Average documentation quality: The CDP documentation is too concise, basically auto-generated type documentation based on input/output parameters. It can only be used for querying and verification. Getting complete concepts from it is still too difficult for both AI and humans
- Dynamic API iteration: Although CDP is open-sourced, it's essentially a private protocol serving Chromium. Its latest version is continuously iterating, so this dynamic change also affects AI's performance
For these reasons, my strategy is "small steps, quick iteration, constant verification". The approach is: for the functionality you want to implement, first let AI propose a general solution, but don't write directly in your iterative project. Instead, first generate a minimal DEMO that can quickly verify the related functionality, then personally verify whether this solution meets expectations.
The step of "personally verifying DEMO feasibility" is very important because the reliability of AI's direct CDP solutions is not high, unlike AI -> UI which has higher fault tolerance and confidence. Only solutions verified successful on DEMOs have value for migration to formal projects.
Another solution is to learn from excellent projects like puppeteer. Puppeteer also calls CDP at its core, and it has been iterating for over a decade, having accumulated a set of mature solutions for common cases. By studying its internal CDP call flow, you can learn many application scenarios not described in the documentation. In the next blog, we will analyze puppeteer's source code architecture to make us more proficient in the calling process.